Since I wasn't really in the mood to upgrade Cacti then and there for this one graph, I decided to recreate as much as I could of the graph using the information Barry had helpfully provided.
Data Sources
The first step is to configure the Data Sources. I'm sure there's a way to simplify this, but I haven't figured it out yet, so you'll need 1 Data Source for all active channels and 1 Data Source per E1.
All Active Channels
Go to Data Sources->Add, and use the following:
Selected Data Template: SNMP - Generic OID Template
Host: Choose the host for this Data Source
Click on Create to go to the next configuration page.
Change the following fields:
Name: |host_description| - Active Channels
OID: 1.3.6.1.4.1.9.10.19.1.1.4.0
Click Save and you're done.
E1 x/x
You'll do the same thing for the E1s, except for the following:
Name: |host_description| - E1 2/0
OID: .1.3.6.1.4.1.9.10.19.1.1.9.1.3.2.0
The last 2 digits of the OID are the slot and port numbers. For E1 2/0, it's .2.0, for E1 3/1, it would be .3.1
Do this for each E1.
Graph Template
Now, we need to add a new graph template. Here are the fields I changed:
Name: AS5350 E1 Usage
Title (check Use Per-Graph Value): |host_description| - E1 Usage
Vertical Label (check User Per-Graph Value): Channels
Click Create and we'll start creating the actual graph.
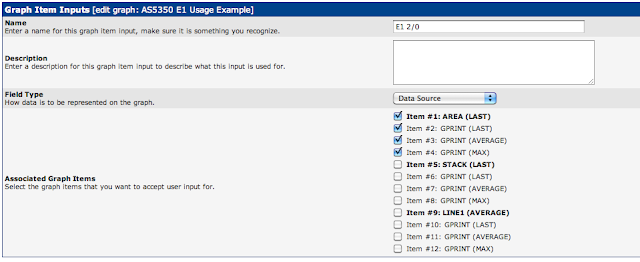
Graph Item Inputs
First, we'll need to add our inputs. For this, I'm only going to use 2 E1s to show you how it's done. My production config has 2 templates: one for 2xE1 cards and one for 4xE1 cards.
For now, just add the name and use Field Type: Data Source.
I created 3, one for each E1 and one for all Active Channels.
Graph Template Items
Next, we'll add the Graph Template Items. You'll have 4 entries for each Data Source: the graph itself, and 3 GPRINT values for current, average and maximum.


The last picture doesn't show it, but check Insert Hard Return for the last value. It will show up as
on the main template page.
You should now have the following:
You'll notice I changed the colors around from the previous screenshots. The main things to note are the Graph Item Types and the CF Type.
Also, Cacti may automatically add a Data Source [snmp_oid] field. Go ahead and delete it.
Now, we need to go through our Data Sources and make sure they match up with their graph items.


Save the template and we're ready to create our graph.
Creating the Graph
Go to Graph Management and Add a new graph. Use the template we just created, and then select the appropriate Data Sources. If all goes well, your graph should look like this:
ERROR:the RRD does not contain an RRA matching the chosen CF
This error had me stumped for a while, but I found the answer on this thread on the Cacti Forums.
Here's the crucial piece of information:
LAST appears to work fine in a GPRINT but in an AREA or LINE no joyAfter changing the Line to Average, but leaving the GPRINT as Last, everything worked fine. You can see that the graphs for the E1s are set to Last, but the line graph for all of the channels is set to Average.


